Kee
Project page
What is it?
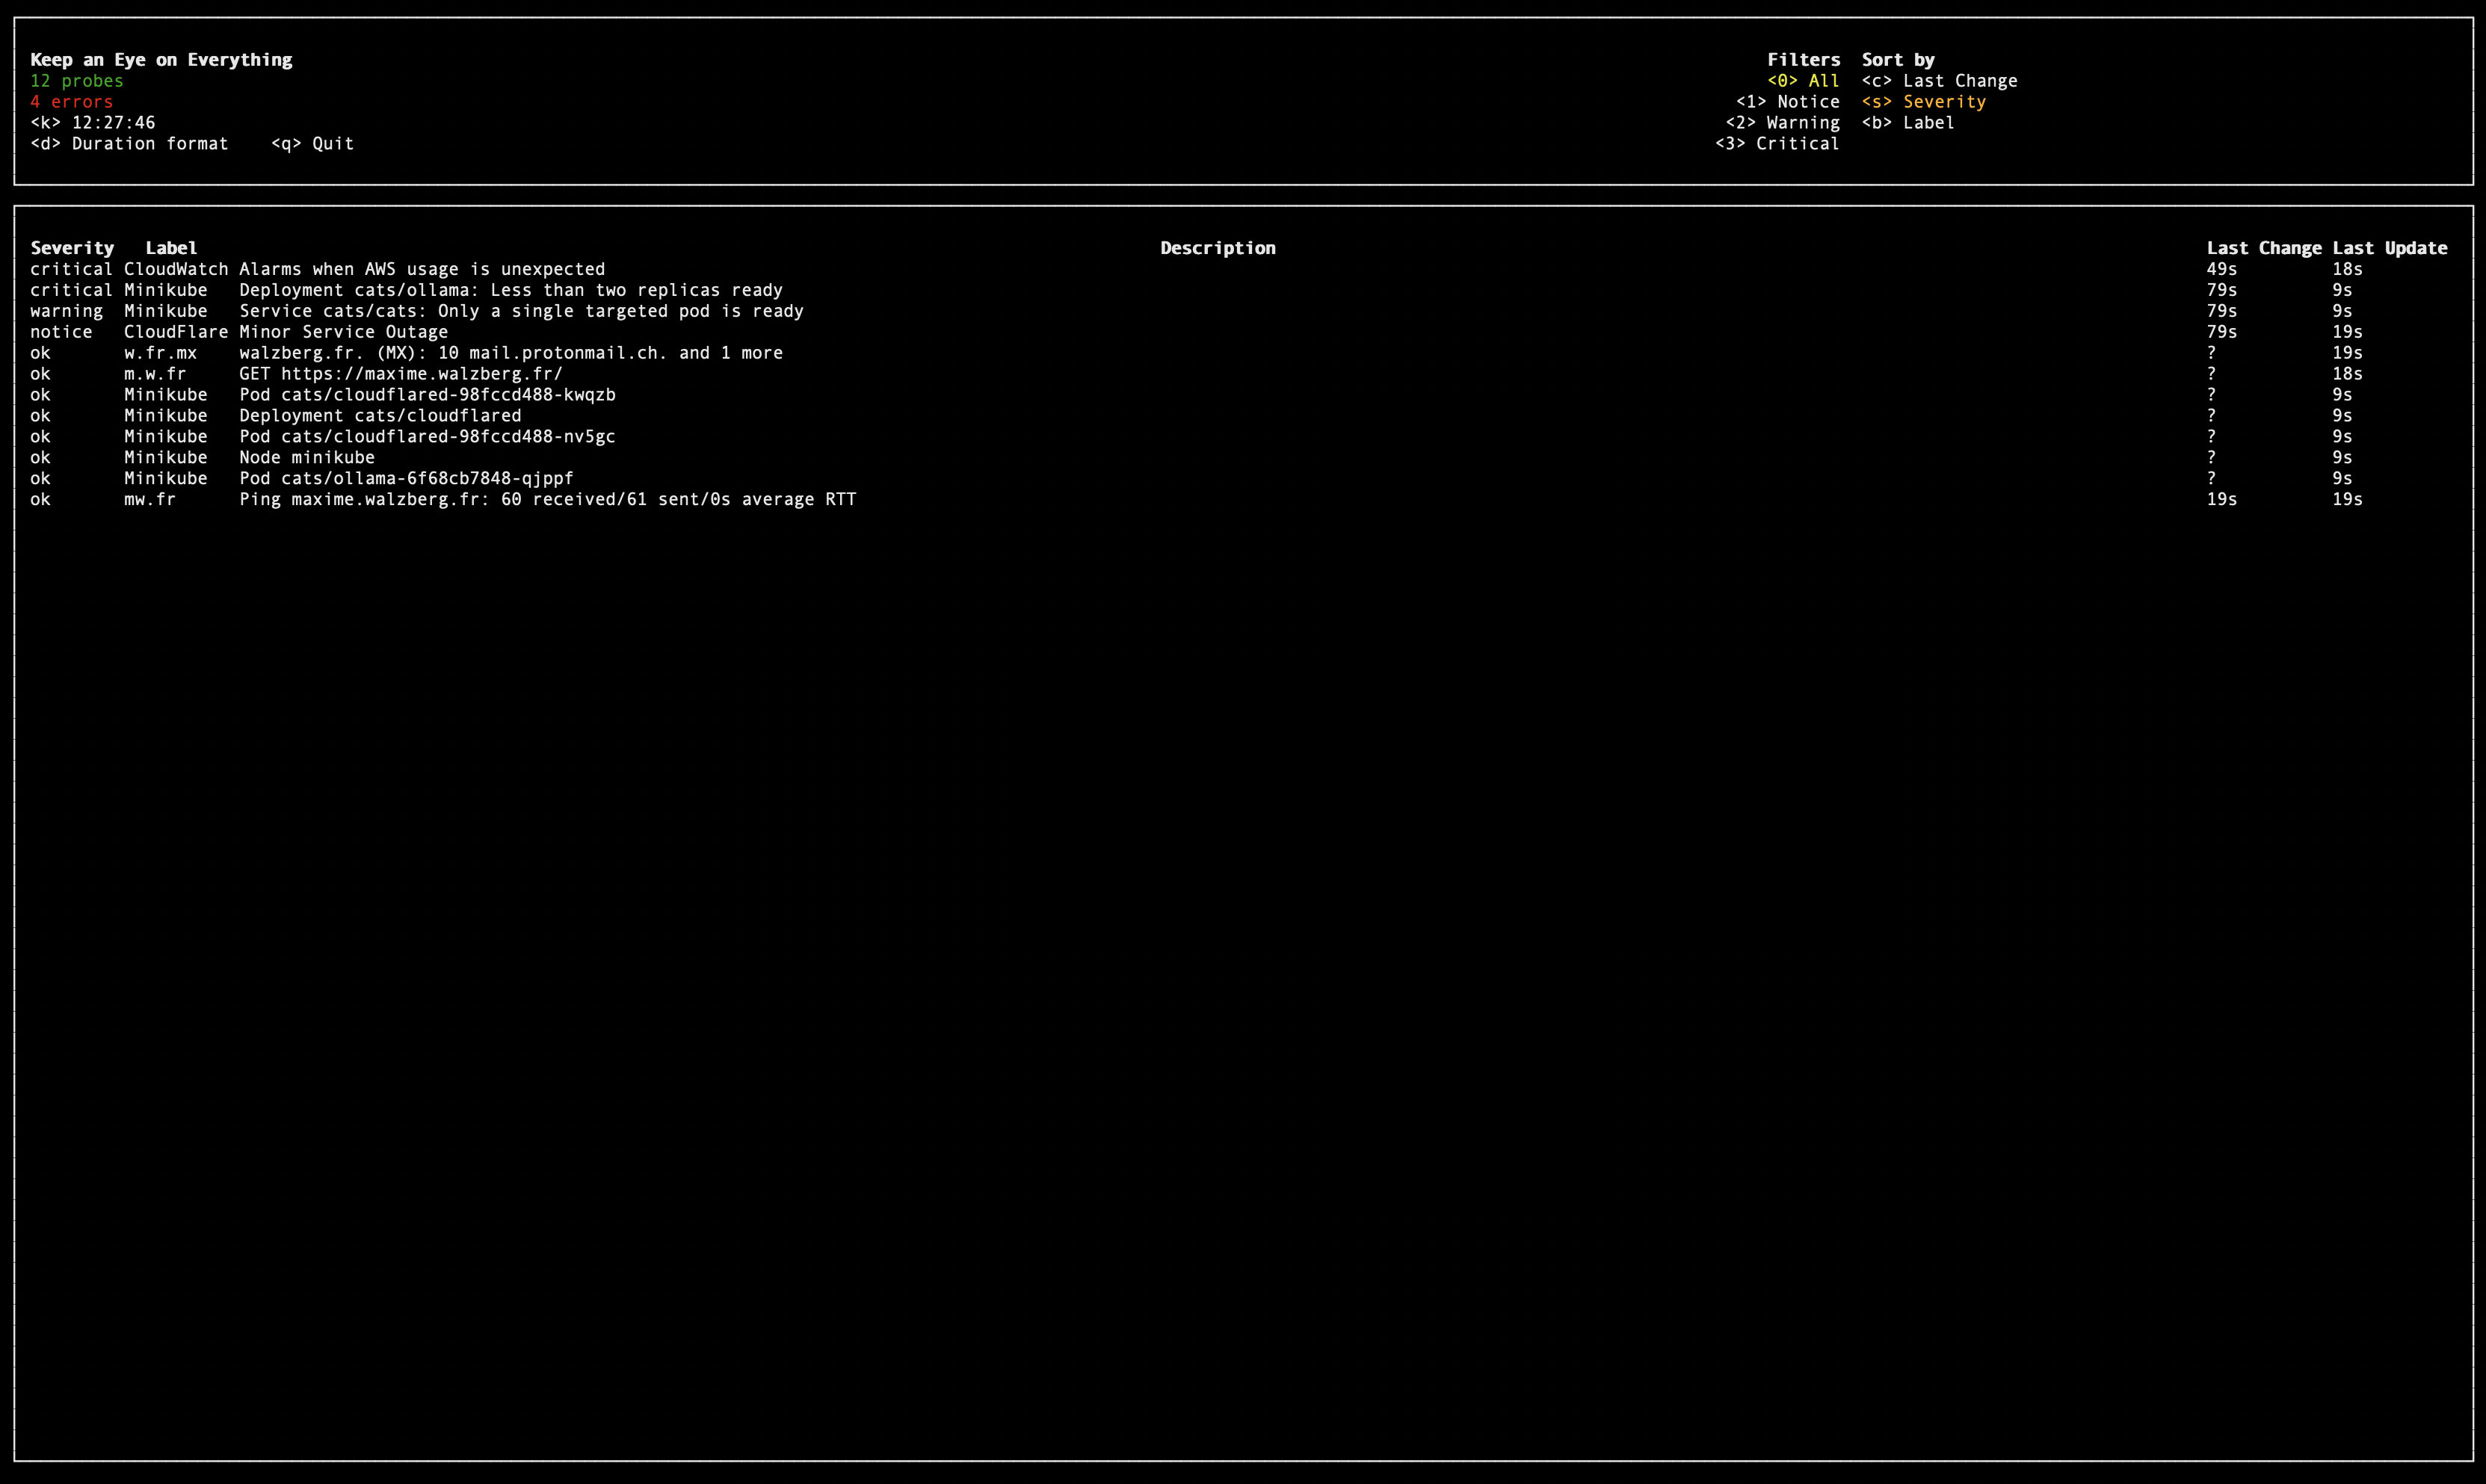
 Kee is a CLI monitoring tool for your backend systems.
While it doesn't replace well known monitoring services such as CloudWatch, Grafana, Datadog... it aims to report on a broad range of layers and services of your backend systems. Check the overall health of your systems at a glance, from the cloud providers themselves, to your orchestrator and application, but also build-time systems such as your version control platform.
Kee is easy to configure, use, and is designed to run on your laptop, not on the server.
It's written in Go and can be installed with git clone https://git.walzberg.fr/kee.git && cd kee && go install .. Configuration files are written with Terraform's' HCL, and supports variables.

Why?
Saturday, 2am
The first notification barely brought your body to a lighter sleep phase. But the second notification, 3 minutes later, really woke you up. No doubt, an alarm was triggered from one of your backend systems. You barely find your phone without dropping it, the backlight hurts your eyes. You acknowledge the alarm. Your significant other is significantly annoyed. You try to put on some minimum amount of clothes without making too much noise or light, but it's pointless since even your cat is on alert by now.
You found your way to your home office. You take another look at the alert from your phone, but you have to dig a bit too much to find the human readable description of the alarm. You wake up your laptop, and maybe you have to try your password twice. You're still not sure what happened and what you should check first. Should you start with k9s to check your Kubernetes cluster? Or log in your cloud provider console and look at dashboards? Maybe try a few requests from Postman, see how much of the user-facing things are impacted? Wait, does the alerting app's link to the cause even works?
You remember a tool that your coworker mentionned. This tool is Kee, and will show you what's up as clearly, quickly and simply as possible.

Tuesday, 10am
Today's a big day. You're about to upgrade a database using a blue/green deployment. This will take most of your day. There is a short downtime scheduled for your app, but it should mostly go unnoticed. Still, you want to keep an eye on everything during the whole procedure: making sure your cloud provider doesn't go down while running the critical steps, that your app goes down and back up as expected, and if anything unexpected happens.
Yes, Kee is great for that purpose as well.

Thursday, 3pm
Your coworker blesses you a with Slack message. The deployment pipeline is stuck. It could be your version control platform, your self-hosted CI runners, maybe the build artifact registry? Or even your orchestrator? Did someone click-opsed change that super important TXT record again?
Because Kee is designed to monitor 3rd parties as well as your own cloud resources and systems, you get a holistic view of ... everything. With the complexity and ever growing inter-dependencies of systems today, having a custom, simplified, overall view of it all appears to be... useful.
Look here to get started or read more about how Kee is built below.

Architecture
Probe providers registry
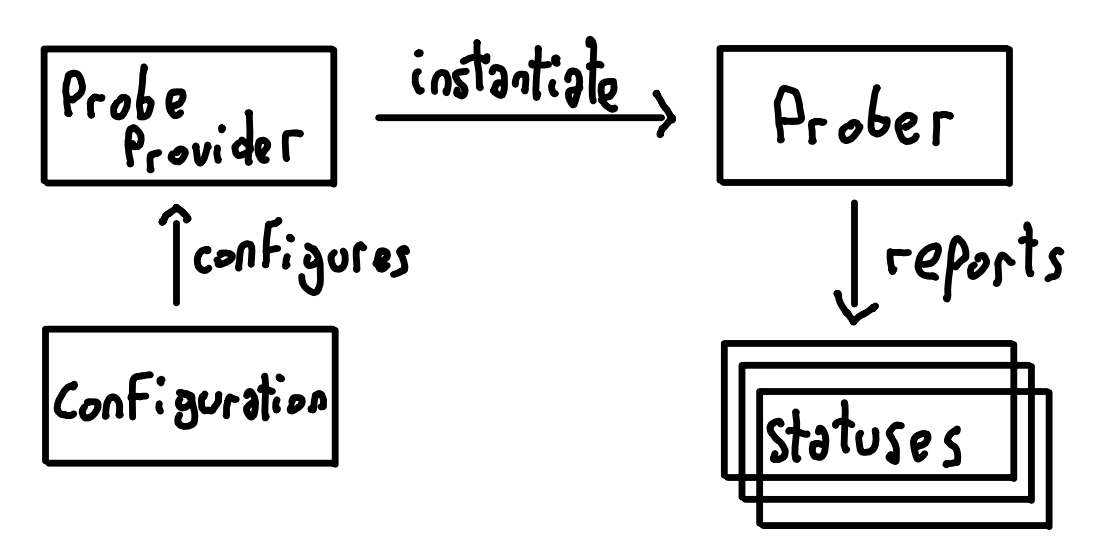
The probe provider system is very much Terraform-inspired. Not everyone runs the same things, so I wanted the ability to configure different monitoring clients. A probe provider is basically a name (string) and a function. The function, provided adequate configuration, returns a object that implements a single-function interface, Prober.

Contrary to how Terraform works, all probes are currently statically compiled in the single Kee binary. Terraform has a main binary, but then downloads different providers for different clouds and services as needed, verifies their signature, runs them and communicates with them in order to provision the infrastructure. Kee on the other hand, has an internal dictionary (map[string]provider) and when the executable is run, each probe registers itself on that map. Then the configuration is read and the probe providers are found from the map.
There are, however, benefits to the Terraform approach of downloading separate specific binaries, that would be useful if Kee grows more:
- Versionning: if you need specific versions of probe providers, or even different versions of the same provider, but they are not bundled in the single binary.
- Binary size: Kee packs client libraries for various systems, and the single binary has been growing in size. This is not only about downloading it, but also means longer startup time since the OS has to load more into memory.
- Resilience: if a provider crashes, it doesn't bring down the whole app with it, which is especially important for monitoring.
- Security: You will probably pass credentials in various ways, and while different provider binaries will still have access to the same environment variables and filesystem, they may further fetch session tokens or sensitive values, and running in separate binaries will take advantage of the OS memory safety features.
- Infrastructure: where to download those binaries from? Where do we fetch the list of all available providers?
- Security: downloading and running arbitrary programs on users laptops is super risky. Providers should be verified and signed so that users can trust what they run. This means setting up a PKI and a thorough validation process.
- Builds: providers will have to build for a range of supported architectures and platforms.
There is a third solution, even more static: instead of a Go map, use a switch statement. Since finding probes by name is only done once at startup, it's unlikely that a switch will bring any noticeable improvement. It also feels less flexible and future-proof than a map: you can range over all items in a map, but not on a switch. Below I write about more automation, and being able to list all providers seems like a important capability to make progress towards that goal.
Concurrency
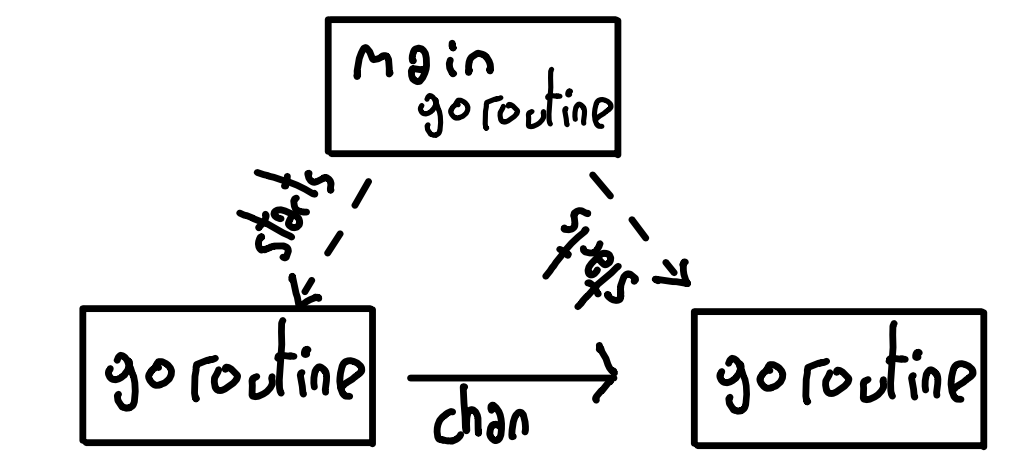
It's not an accident if Kee's design seems to fit the goroutine/channel model perfectly: I like playing with those. Basically each configured probe runs in its own goroutine. The Probe() method is run at the configured interval, and its results are sent and routed through the app pipeline via Go channels. Keystrokes are intercepted from the UI library and their meaning sent from the view goroutine to the controller goroutine.
Shortly put, goroutines are used to run multiple Go functions concurrently. Their execution is scheduled on threads by the Go runtime, which is built in your binaries by the compiler. Goroutines are lightweight because they only have a stack; the heap is shared and not protected against concurrent use at all. So to safely share data between them, the chan is the promoted way.
A channel is both a synchronisation mechanism and a data sharing mechanism. Unless specified otherwise, both goroutines are blocked at the send/receive expression until they are both ready for the exchange to happen. A third concept, Contexts, will help you carry cancellation signals across goroutines (signals when a infinite-loop goroutine should break its loop and cleanup the resources it allocated) as well as arbitrary configuration-like data or shared threadsafe resources (context.WithValue).

While I feel channels are a good fit in Kee, you can end up with channel spaghettis, and in some places it's just easier to use well known Mutexes. I did use chans all the way as an experiment to see if it would work and still be maintainable. But there are interesting reads about the naive use of channels.
The Go runtime also handles non-blocking I/O on the side by managing an event-loop thread, and you can read more about this here and here. These articles provide more background about the Go scheduler and its management of network operations.
MVC
As hinted above, Kee is organised following the well known Model-View-Controller paradigm. Each of these functions are performed in their own goroutine, except for the model:
- Model: The model is essentially an independent Go package made of shared data types. Most parts of Kee, including probes implementations, need the model so they have a common understanding of the data that is exchanged.
- View: The view runs an infinite loop in its own goroutine. It only handles presentation and receiving the user's commands, and handles no logic whatsoever. It receives updates from the controller, in a presentation-oriented data structure.
- Controller: The controller runs an infinite loop in its own goroutine as well. It receives commands from the view, status updates from the probes, and builds and ships the view structure to be displayed by the view component.
- Probe runners: Each configured probe will run in its own goroutine. The probe runner calls the probe provider at the configured interval, ensure the unicity and consistency of the status returned (ID, label) and ships the status to the controller compoenent.

Less is more
The Go language prides itself with being stubbornely simple, even boring. Who never got tired of writing if err != nil, even with editor autocompletion? But the underlying philosophy, less is more, is very powerful. Because you don't have many keywords, grammar rules and concepts in the language, and because the features that do exist are working together in a very orthogonal way - no surprises where two cool features can't be used together - the programmer can really focus on building the concepts and primitives that are important in his use case.
In Kee, I used both object oriented and functional style approaches, for different purposes. Data structures that are allocated at program startup, used throughout the life of the process, and not shared across goroutines are objects (pointers to structs).
But short-lived, passed around threads data structures are values. This may be slightly inefficient (they have to be copied in memory everytime they are passed to a function/sent on a chan/returned from a function...) but leaves no possibility of data races. When operating on those values (common model methods like filtering, mapping, ...), we return copies instead of mutating objects. Go's garbage collector works, and in practice these memory copies don't seem to affect performance nor memory usage.
One optimisation I use as much as possible is preallocating slices (aka vectors) to a known capacity. I did not use any of the newer generics features of the language.
It's true that with any language, no matter how complicated, you can try to limit the subset of features you use, and find yourself on Go territory. I remember Javascript: The good parts book by Douglas Crockford - its thinness compared to the Definitive guide being a recurring joke and even a meme.

But such an approach of using subsets of a language isn't always practical. You may need to use a 3rd party library that forces you to use features you didn't want to. Or you may not agree with your coworkers on which parts are the good ones. With Go you don't have many parts, so it's harder to debate which ones you won't use.
Refactoring & Tests
Go code is easy enough to refactor. Because of the language simplicity, the straightforward approach to packages and the ability to split a single-file package to multiple files, you don't need much more than a global find/replace functionnality to rework a codebase. Of course having tests will help you check that you didn't break anything.
Kee's testsuite is not covering the whole codebase, but I take pride in testing the providers as close to reality as possible: the AWS CloudWatch probe really sets up testing alarms in AWS and verifies behaviour from the real cloud provider. Same goes for Kubernetes and ping: they are tested against the real things. The HTTP test uses the handy Go test server, while the DNS probe test spins up a local DNS server.
Librairies
HCL
Kee was not built from scratch. An important library that I use is Hashicorp's HCL. It was very interesting to dig into the internals of the configuration language for Terraform, and it brings nice benefits:
- Readability: using comments, blocks with labels, and no need to quote attributes names.
- Expressiveness: while there aren't many functions available for the configuration files, HCL still brings expressions, which we can use to inject variables or computed values in the configuration. I find it much less awkward than injecting weird, not-in-the-specification templating languages into, say, YAML.
-
Flexibility: it's easy to express blocks that have both common attributes and specific attributes based on one of their label. It's also easy to evaluate an expression now, or later (if you have configuration dependencies). This makes sense, as those features are required for Terraform
resources. - Tooling: besides the libraries to parse the configuration, there is also a library to write HCL configuration from Go code. The tool to format Terraform code also works with Kee configuration. And probably more...
tview
The tview package handles the UI. It's used by other tools I love such as k9s. It works great so far, but I'm overriding the controls keyboard shortcuts for simplicity - so it's mostly used to display information, and not so much to navigate in the app.
Clients
Probes are mostly wrappers around a client library, for example the AWS Go SDK or the Kubernetes client. Some are easier to deal with than others. Kubernetes has complex data structures. The ping library I use wants to continuously run in its own goroutine. DNS somehow seems to be always more complicated than what I thought I understood of it.
Next
Probes
There is still much work to do, and many improvements to bring. One area of course is the probe providers:
-
Implementing new probes:
GCP metrics(implemented but scraped due to poor GCP APIs)GCP's own infrastructure status(implemented but scraped due to poor GCP APIs)- AWS Personal Health Dashboard
- AWS Trusted advisor
- Grafana alerts
- Basic shell command - always nice to have, brings lots of flexibility
-
Splitting some existing probes:
k8s: one provider per kind of object (k8s_pod, k8s_service, ...)statuspage:statuspage_statusandstatuspage_componentsdns: record type specialised probes (maybe).
-
Adding features to existing probes:
http: ability to run simple scenarios with multiple sequential requests, capturing data from responses to allow dynamic requestsping: general improvements and fixes are needed (improved in v1.1.0, more work needed)k8s: label query filters- Improve configuration validation overall
- Improve status descriptions overall
Features
I also have lots of ideas for global features:
Status change log: useful for post mortems, providing the ability to retrace the chain of events from the moment kee started(done in v1.1.0 🎉)Layers: each probe has a default, or custom-configured layer, such as infrastructure, platform, or application. You can then filter statuses based on layers from the interface, much like severities(done in v1.1.0 🥳)- Dependencies: going further than layers, we could try to model dependencies and display statuses as a cause-effects tree
- Logs: switch the view to display logs relevant to the current context
Theming: better default theme and everything customisable(done in v1.1.0 🚀)- Auto-configure from a Terraform state: maybe?
- And more...
Automation, pipeline, documentation
- Automate documentation for the configuration, both general and for each probe
- Improve the local developper experience (with Make/taskfile)
Improve the CI pipeline- Keep improving test coverage
Give it a try, and happy monitoring!
